Mobile App Memory Leaks: Causes, Symptoms and Fixes

Md Hamim Khan
Md. Hamim Khan is the Co-Founder and CEO…
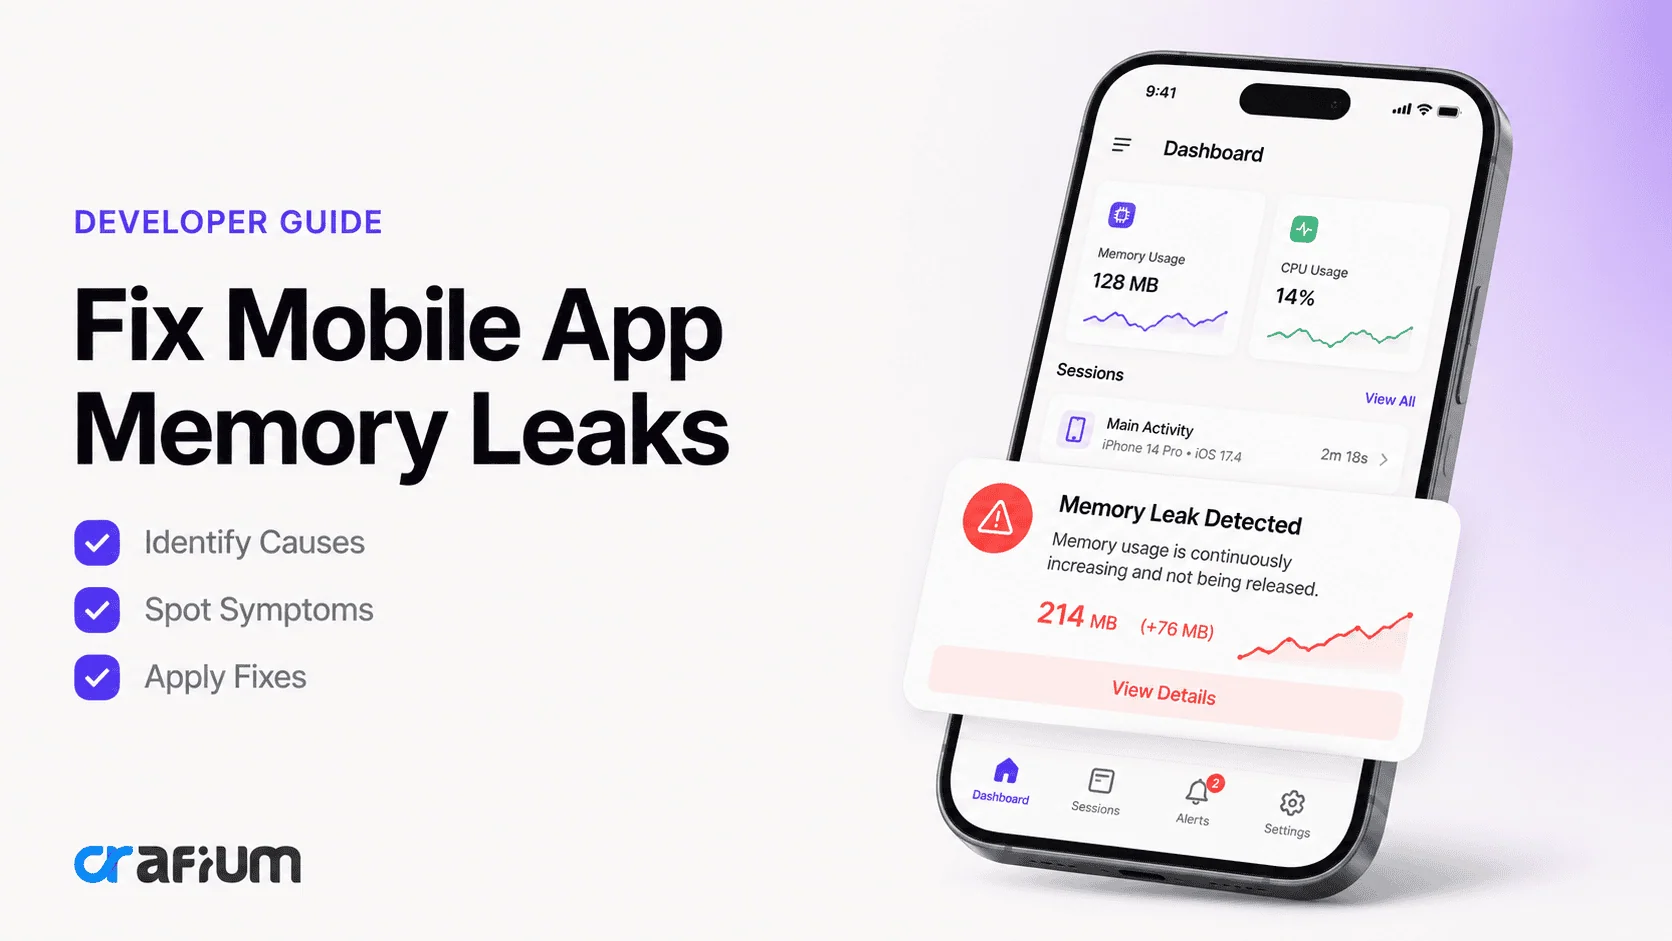
In this article
Memory management is one of the most critical aspects of mobile app development. Even a feature-rich application can suffer from crashes, slow performance, and poor user reviews if it fails to manage memory efficiently.
One of the most common performance issues developers face is a mobile app memory leak. While memory leaks may seem like a minor technical problem at first, they can gradually consume device resources, degrade performance, and ultimately lead to app crashes.
For users, memory leaks often appear as random slowdowns, excessive battery drain, or apps that become increasingly unstable over time. For developers, they can become a major obstacle to app growth, retention, and long-term success.
In this guide, we’ll explore what memory leaks are, their causes, warning signs, and the best ways to identify and fix them.
Mobile App Memory Leaks Explained
A memory leak occurs when an application allocates memory but fails to release it after the memory is no longer needed.
Normally, operating systems reclaim unused memory automatically. However, when an app continues holding references to unused objects, the memory remains occupied unnecessarily.
Over time, leaked memory accumulates and reduces the amount of available RAM on the device.
As memory consumption grows, the application may experience:
- Slower performance
- UI lag
- Increased battery usage
- Higher CPU consumption
- App freezes
- Unexpected crashes
In severe cases, the operating system may force-close the application to protect overall device performance.
Why Memory Leaks Matter
Memory leaks affect far more than technical performance metrics.
Users expect apps to be responsive, stable, and efficient. Even minor slowdowns can negatively impact user satisfaction and retention.
Research consistently shows that users quickly abandon apps that feel sluggish or unstable.
Memory leaks can lead to:
- Reduced app retention
- Lower app store ratings
- Increased uninstall rates
- Higher support requests
- Poor user experience
- Greater maintenance costs
For businesses, fixing memory leaks isn’t just a technical task. It’s essential for protecting revenue and user engagement.
Common Causes of Mobile App Memory Leaks
Memory leaks can occur for many reasons during app development.
Understanding the most common causes makes prevention significantly easier.
Unreleased object references
One of the most frequent causes of memory leaks is retaining references to objects that are no longer needed.
As long as an object remains referenced, the garbage collector cannot reclaim its memory.
Examples include:
- Stored activities
- Unused view references
- Cached data objects
- Background service references
Improper event listener management
Event listeners help applications respond to user actions and system events.
However, failing to unregister listeners after use can cause objects to remain in memory indefinitely.
This issue is particularly common in:
- User interface components
- Lifecycle events
- Background services
- Notification handlers
Static references
Static variables persist throughout the application’s lifetime.
If a static reference points to an activity, view, or context, it may prevent memory cleanup.
Over time, these references can create significant memory leaks.
Background tasks that never stop
Long-running processes can consume resources unnecessarily when not properly managed.
Common examples include:
- Network requests
- Timers
- Threads
- Coroutines
- Scheduled jobs
If these processes continue running after users leave a screen, memory usage can steadily increase.
Context leaks in Android
Android developers frequently encounter context-related memory leaks.
Holding references to an Activity context beyond its lifecycle can prevent garbage collection and retain large amounts of memory.
Retain cycles in iOS
In iOS development, retain cycles occur when two objects maintain strong references to each other.
Since neither object can be released, memory remains permanently allocated.
This issue often appears in:
- Delegates
- Closures
- View controllers
- Callback handlers
Improper cache management
Caching improves performance, but excessive or unmanaged caching can consume large amounts of memory.
Applications that never clear outdated cache data may eventually experience memory pressure and instability.
Symptoms of Memory Leaks in Mobile Apps
Memory leaks rarely appear immediately.
Instead, they gradually impact application performance over time.
Increasing memory usage
One of the clearest indicators is steadily growing memory consumption during normal app usage.
The app continues consuming additional memory without releasing resources.
Slower app performance
As available memory decreases, users may notice:
- Delayed screen transitions
- Sluggish scrolling
- Input lag
- Reduced responsiveness
These issues often worsen the longer the app remains open.
Frequent crashes
When memory usage exceeds available resources, applications may crash unexpectedly.
Users often report crashes after prolonged sessions rather than immediately after launch.
Excessive battery drain
Memory leaks frequently increase CPU activity.
Higher processing demands result in greater power consumption and reduced battery life.
Device overheating
Increased resource utilization can generate additional heat.
Users may notice their devices becoming unusually warm while using the affected application.
System warnings
Both Android and iOS may generate warnings when applications consume excessive memory.
These warnings often appear before app crashes occur.
How to Detect Memory Leaks
Finding memory leaks early can prevent major performance issues.
Fortunately, modern development tools make leak detection significantly easier.
Monitor memory usage
The first step is analyzing memory behavior during app operation.
Developers should watch for:
- Continuous memory growth
- Unreleased objects
- Unexpected allocations
- Abnormal resource retention
Consistent increases often indicate leaks.
Use Android Profiler
Android Studio includes powerful memory profiling tools.
Android Profiler helps developers:
- Track allocations
- Monitor memory consumption
- Identify retained objects
- Analyze garbage collection behavior
It is one of the most effective tools for Android leak detection.
Use LeakCanary
LeakCanary is a popular Android library designed specifically for memory leak detection.
It automatically identifies leaked activities, fragments, and other objects during development.
Use Xcode Instruments
iOS developers can use Instruments within Xcode to analyze memory behavior.
The Leaks instrument helps identify:
- Retain cycles
- Unreleased objects
- Persistent allocations
- Memory growth patterns
Conduct stress testing
Extended testing sessions help reveal leaks that may not appear during short interactions.
Developers should test:
- Long usage sessions
- Repeated screen navigation
- Background activity
- Heavy data processing
Fixing Memory Leaks in Android Apps
Android developers can reduce memory leaks by following several best practices.
1. Avoid holding Activity references
Activities should be released when their lifecycle ends.
Avoid storing Activity references in:
- Static variables
- Singleton classes
- Long-running services
2. Unregister listeners properly
Always remove listeners when they are no longer needed.
This includes:
- Broadcast receivers
- Location listeners
- Event callbacks
- Observers
3. Use WeakReference when appropriate
Weak references allow objects to be garbage collected even if referenced elsewhere.
They can help reduce unintended memory retention.
4. Cancel background tasks
Tasks that outlive their associated screens should be stopped immediately.
This prevents unnecessary resource consumption.
Fixing Memory Leaks in iOS Apps
iOS developers have several effective techniques for preventing leaks.
i. Use weak references
Weak references prevent retain cycles by allowing objects to be released when no longer needed.
This approach is commonly used with delegates.
ii. Review closures carefully
Closures often capture strong references unintentionally.
Using capture lists can prevent retain cycles and improve memory management.
iii. Release unused resources
Images, large datasets, and temporary objects should be released when no longer required.
This reduces overall memory pressure.
iv. Monitor object lifecycles
Regular lifecycle audits help identify objects that persist longer than intended.
Detecting these issues early prevents future stability problems.
Best Practices to Prevent Memory Leaks
Prevention is always easier than fixing issues after release.
The following practices help maintain healthy memory usage.
Perform regular memory audits
Routine performance reviews can identify issues before users notice them.
Developers should incorporate memory testing into every release cycle.
Follow platform lifecycle guidelines
Android and iOS provide lifecycle frameworks designed to prevent resource retention.
Adhering to these guidelines minimizes leak risks.
Limit unnecessary caching
Cache only essential resources and implement automatic cleanup mechanisms.
Uncontrolled caching is a common source of excessive memory consumption.
Optimize image handling
Large images consume significant memory.
Using compression, lazy loading, and image resizing reduces resource usage.
Test on lower-end devices
Memory issues often appear first on devices with limited RAM.
Testing across a wide range of hardware improves app stability.
How AppNatively Helps Build Optimized Mobile Apps
Performance optimization starts with choosing the right development approach.
AppNatively helps businesses build native mobile apps that prioritize speed, efficiency, and user experience from the beginning.
A well-structured native application is less likely to suffer from performance bottlenecks that often contribute to excessive memory usage.
Benefits include:
- Native app performance for Android and iOS
- Faster application responsiveness
- Optimized resource management
- Better user experience and retention
- Simplified deployment and maintenance
Whether you’re launching a new app or modernizing an existing digital product, building on a performance-focused foundation helps reduce technical debt and improves long-term scalability.
Final Thoughts
Mobile app memory leaks are among the most common causes of performance degradation, instability, and app crashes. While they may begin as minor issues, they can quickly impact user experience, retention, and business growth if left unresolved.
By understanding the causes of memory leaks, recognizing their symptoms, and using modern diagnostic tools, developers can identify problems early and maintain healthier applications.
Implementing proper memory management practices, monitoring resource usage, and conducting regular performance testing will help ensure your mobile app remains fast, reliable, and scalable as it grows.
Frequently Asked Questions
What is a memory leak in a mobile app?
A memory leak occurs when an application retains memory that is no longer needed, preventing the operating system from reclaiming those resources.
How do memory leaks affect users?
Memory leaks can cause slow performance, increased battery consumption, overheating, crashes, and reduced responsiveness.
Are memory leaks more common on Android or iOS?
Both platforms can experience memory leaks. However, the underlying causes often differ due to differences in memory management systems.
Can memory leaks cause app crashes?
Yes. Severe memory leaks can exhaust available resources and force the operating system to terminate the application.
How can developers find memory leaks?
Tools such as Android Profiler, LeakCanary, and Xcode Instruments help identify memory leaks and resource retention issues.
Tags:
Share this blog:

About Md Hamim Khan
Md. Hamim Khan is the Co-Founder and CEO of Crafium, leading the company’s vision, growth, and product strategy across its digital and software ventures. With 5+ years of experience in tech and digital marketing, he focuses on building products, driving sustainable growth, and turning ideas into scalable businesses.