How to Fix Slow Mobile App Performance: Complete Guide

Tanjim Hasan
In this article
A mobile app can have excellent features, beautiful UI, and strong functionality, yet still lose users if it feels slow.
A few seconds of waiting during startup, delayed taps, choppy scrolling, slow image loading, or screens that freeze can make an app feel broken. Performance is not simply a technical concern. It directly affects how users perceive the quality and reliability of your product.
Apple notes that slow launches and unresponsive interactions can make an app appear sluggish or even nonfunctional, while excessive network activity can increase data usage and battery consumption.
The good news is that slow app performance is usually measurable and fixable.
In this blog post, you’ll learn how to fix slow mobile app performance, how to identify the real bottleneck, what to optimize on Android and iOS, and how to prevent performance problems from coming back.
What Does Slow Mobile App Performance Actually Mean?
A slow mobile app is not necessarily an app that takes a long time to open. Performance problems can appear in several different ways.
Your app might take too long to launch. A screen may take several seconds to display content. Scrolling may feel choppy. Buttons may respond late. Images may appear slowly. The app may freeze while processing something in the background.
Battery drain and excessive memory consumption are also performance problems. Android describes poor performance in terms of issues such as slow responses, choppy animations, freezes, and excessive power consumption.
On iOS, Apple focuses heavily on responsiveness, hangs, hitches, launch time, memory usage, disk activity, network activity, and energy consumption.
That means improving performance requires looking at the entire app rather than optimizing one piece of code.
How to Tell If Your Mobile App Is Slow
Before changing anything, identify what “slow” actually means.
Ask these questions:
- Does the app take too long to launch?
- Does the first screen take too long to become usable?
- Do taps or gestures feel delayed?
- Does scrolling stutter?
- Do images take too long to appear?
- Does the app freeze while loading data?
- Does performance become worse after prolonged use?
- Does the problem happen only on older or lower-end devices?
- Does the app become slow on mobile networks but work normally on Wi-Fi?
- Does the app consume unusually high battery or memory?
These questions help narrow down the source of the problem.
For example, if your app is fast after opening but a product page takes five seconds to display, the problem may be network requests or backend processing rather than app startup.
If scrolling becomes increasingly slow after browsing hundreds of products, memory management or inefficient rendering may be the real issue.
The First Rule: Don’t Optimize Without Measuring
One of the biggest mistakes developers make is guessing.
They see a slow screen and immediately start rewriting code.
That can waste hours while leaving the actual bottleneck untouched.
A better approach is:
Measure → Identify → Optimize → Test → Measure again
Apple recommends essentially this continuous performance-improvement cycle: gather information, measure behavior, make a targeted change, implement it, and verify whether performance actually improved.
This approach matters because the most obvious problem isn’t always the most important one.
Your app may have a large image, for example, but the real delay could be a slow API request happening before that image is displayed.
How to Fix Slow Mobile App Performance
Slow mobile app performance can frustrate users, increase drop-offs, and make even a well-designed product feel unreliable. Let’s fix it.
Step 1: Identify the type of performance problem
Start by categorizing the problem.
Slow app startup
The app takes too long to become usable after the user taps the icon.
Slow screen loading
The app opens quickly, but individual screens take too long to display meaningful content.
Slow interactions
Buttons, gestures, search fields, menus, or other controls respond late.
Choppy scrolling
Lists, feeds, product grids, or directories don’t scroll smoothly.
Slow network performance
The app waits too long for APIs, images, videos, or other remote resources.
Memory-related slowdown
The app becomes slower after extended use or starts crashing after navigating through multiple screens.
Excessive battery consumption
The app performs unnecessary background work, location updates, synchronization, or other expensive operations.
Each category requires a slightly different solution.
Step 2: Measure app startup time
Startup is one of the first things users notice.
Android’s current performance guidance recommends aiming for a cold start under 500ms, with warm starts under 200ms and hot starts under 150ms. These are goals rather than universal guarantees, but they provide useful benchmarks.
A common reason for slow startup is doing too much work before showing the first useful screen.
For example, your app might initialize:
- Analytics.
- Multiple SDKs.
- Remote configuration.
- Large databases.
- Authentication checks.
- Network requests.
- Image processing.
- Third-party libraries.
All before showing useful content. That creates unnecessary startup work.
How to improve startup performance
Load only what is necessary for the initial experience.
Move non-critical initialization until after the first screen becomes usable.
Avoid making multiple network requests during startup when they aren’t required immediately.
Delay expensive database operations.
Lazy-load features that users may never access.
Reduce unnecessary third-party SDK initialization.
On Android, Google’s current optimization guidance recommends tools and techniques such as Baseline Profiles, startup profiles, App Startup, optimized splash screens, and startup tracing.
The goal is simple:
Show useful content first. Do secondary work afterward.
Step 3: Stop blocking the main UI thread
This is one of the most important performance principles in mobile development.
The main thread is responsible for keeping the interface responsive. If you make it perform expensive calculations, database operations, file processing, image manipulation, or synchronous network work, the interface can stop responding.
That produces the familiar experience:
Tap.
Nothing happens.
Wait.
The screen finally responds.
Apple recommends keeping synchronous work responding to discrete user interactions below roughly 100ms and avoiding unnecessary work on the main thread.
Move expensive work away from the UI thread
Operations that don’t need immediate UI execution should generally happen through appropriate background or concurrency mechanisms.
Examples include:
- Database processing.
- Large JSON parsing.
- Image processing.
- File operations.
- Network requests.
- Complex calculations.
- Data synchronization.
The UI should receive the result when the work is complete.
This creates a much more responsive experience even when the underlying operation still takes some time.
Step 4: Optimize API and network requests
A mobile app can be perfectly optimized locally and still feel slow because the backend is slow.
Network performance is often overlooked.
Suppose a screen needs five separate API requests before it can display meaningful content.
Even if each request takes only 300ms, the combined experience can become noticeably slower, particularly on mobile networks.
Reduce unnecessary requests
Instead of requesting everything immediately, determine what the user actually needs.
- Use pagination for large datasets.
- Load additional content as the user scrolls.
- Cache data that doesn’t change frequently.
- Avoid repeatedly requesting identical information.
- Combine requests where appropriate.
- Return only the fields the mobile client actually needs.
- Avoid downloading large datasets when the screen only displays a small subset.
Don’t make the user wait for everything
A better approach is progressive loading.
Show the screen structure first.
Display immediately available information.
Load secondary content afterward.
For example, an ecommerce app could display the product title, price, and primary image first while reviews, recommendations, and secondary metadata load afterward.
This makes the application feel significantly faster even when the complete data still takes time to arrive.
Step 5: Optimize images and media
Images are frequently responsible for unnecessary network and memory usage.
Large images consume bandwidth, take longer to download, and require more memory to decode.
Android recommends scalable image types such as vector graphics where appropriate and WebP for many raster images, while also recommending that developers minimize the number and size of images loaded during startup.
The same principle applies across mobile platforms:
Don’t download a 3000px image when the screen only displays a 300px thumbnail.
Resize images before delivery
Serve images according to their actual display size.
A product thumbnail shouldn’t require the same image resource as a full-screen product gallery.
Use appropriate compression.
Use modern formats where supported.
Generate multiple image sizes.
Lazy-load images that aren’t immediately visible.
Cache frequently accessed images.
Web performance guidance similarly recommends serving appropriately sized images and reducing the number of bytes transferred over the network.
Don’t load everything at once
Consider a directory app with hundreds of listings.
Loading 100 large images immediately can create:
- High bandwidth usage.
- High memory consumption.
- Longer initial loading.
- Slower scrolling.
- More image decoding work.
Instead, load a small number of visible images and progressively load the rest.
Step 6: Fix choppy scrolling
Scrolling should feel natural.
If users notice frames dropping while moving through a product catalog, social feed, directory, or booking list, the app has a rendering problem.
Common causes include:
- Complex layouts.
- Heavy image decoding.
- Expensive calculations during scrolling.
- Too many UI elements.
- Unnecessary re-rendering.
- Large datasets rendered simultaneously.
- Poor list virtualization.
Android’s profiling guidance specifically recommends investigating rendering problems and common sources of jank, including list components such as RecyclerView.
Use efficient lists
Don’t render hundreds or thousands of items at the same time. Use lazy or virtualized lists where the platform provides them. Only render what is necessary.
Reuse views or cells when appropriate. Avoid performing expensive calculations every time a list item appears.
For image-heavy feeds, combine efficient list rendering with image caching and appropriately sized assets.
Step 7: Reduce memory usage
Memory problems can create performance problems that aren’t immediately obvious.
Your app may feel fine during the first few minutes and gradually become slower.
Users might navigate through multiple screens, open large images, return to previous screens, and repeat the process until memory usage becomes excessive.
Poor memory management can eventually lead to crashes or the operating system terminating or restricting the app.
Apple specifically identifies reducing memory use as an important part of improving responsiveness and reducing the likelihood of the system freeing an app from memory in the background.
Common causes of excessive memory usage
- Large images.
- Memory leaks.
- Keeping unnecessary objects alive.
- Large in-memory datasets.
- Duplicated cached data.
- Unreleased resources.
- Overly complex screens.
How to reduce memory consumption
Release resources that are no longer needed. Avoid keeping entire datasets in memory when pagination is possible.
Resize images before displaying them. Use caching carefully. Avoid unnecessarily retaining large objects.
Profile memory usage rather than assuming where the problem exists.
On iOS, Instruments provides Allocations and Leaks templates for investigating memory problems.
Android Studio also provides profiling tools for identifying inefficient CPU, memory, graphics, and battery usage.
Step 8: Optimize database operations
A local database can become a hidden performance bottleneck.
You may notice it when:
- A search takes too long.
- A screen freezes after opening.
- Lists take several seconds to populate.
- Data synchronization consumes too much time.
- Large queries run repeatedly.
Improve database performance
- Avoid querying unnecessary records.
- Retrieve only required columns.
- Add appropriate indexes.
- Use pagination.
- Avoid repeated queries inside loops.
- Cache frequently accessed data.
Move expensive database operations away from the UI thread. A database query that takes 50ms might not seem problematic.
But running it hundreds of times can quickly become a serious performance issue. The goal isn’t simply to make individual queries faster. It is to reduce unnecessary database work altogether.
Step 9: Reduce unnecessary animations
Animations can make an app feel polished, but excessive animation can hurt performance. Heavy animations can increase CPU and GPU workload, especially on older devices.
Avoid animating elements that don’t need animation. Keep transitions simple.
Don’t run expensive animations while simultaneously loading large datasets or decoding images.
Test animations on lower-end hardware rather than only on your development device.
Smoothness matters more than visual complexity.
Step 10: Be careful with third-party SDKs
Third-party services can add valuable functionality, but every SDK introduces additional code, initialization work, network activity, memory usage, or background behavior.
Common examples include:
- Analytics.
- Advertising.
- Push notifications.
- Crash reporting.
- Social login.
- Maps.
- Chat.
- Payment systems.
- Marketing automation.
Don’t assume an SDK is harmless because you didn’t write it. Measure its impact.
If an SDK isn’t necessary, remove it. If it is necessary, initialize it as late as possible when appropriate.
Also keep SDK versions updated because newer releases may include performance improvements and bug fixes.
Step 11: Optimize background work
Background processing is useful, but unnecessary background activity can consume battery, CPU, network bandwidth, and memory.
Examples include:
- Frequent synchronization.
- Location tracking.
- Repeated polling.
- Background downloads.
- Analytics events.
- Automatic refresh operations.
- Large scheduled tasks.
Instead of constantly checking for changes, use more efficient mechanisms where possible.
Batch work when appropriate.
Avoid running expensive operations more frequently than necessary.
Apple specifically recommends minimizing battery consumption and power-hungry device features as part of maintaining a reliable app experience.
Step 12: Test on real devices
A common mistake is testing only on a powerful development machine or modern flagship smartphone.
That’s not enough.
Performance can vary dramatically depending on:
- CPU.
- RAM.
- GPU.
- Storage speed.
- Operating system version.
- Network quality.
- Battery state.
- Device temperature.
- Background processes.
Test your app on both high-end and lower-end devices.
Also test under realistic network conditions.
An app that feels instant on a fast Wi-Fi connection may feel painfully slow on a weak cellular network.
Apple recommends profiling on physical devices for higher-fidelity measurements, especially when performance problems appear on a particular device class or model.
Step 13: Use the right performance profiling tools
You shouldn’t have to guess what is slowing your app down.
Android Studio Profiler
Android Studio provides profiling capabilities for examining CPU, memory, graphics, battery, and other performance characteristics.
Use it to determine where the application is spending resources instead of simply guessing.
Android performance tools
Android’s performance guidance includes startup tracing, rendering analysis, Baseline Profiles, and production performance monitoring.
Xcode instruments
For iOS, Instruments can help investigate responsiveness, memory, energy, file activity, and network behavior.
Apple recommends specific Instruments templates depending on the problem, including Time Profiler for hangs and unresponsiveness, Allocations and Leaks for memory issues, Energy Log for power consumption, File Activity for I/O, and Network for network-related problems.
The key is to choose the profiler based on the problem you’re investigating.
Step 14: Monitor performance after release
Performance optimization doesn’t end when the app reaches the App Store or Google Play.
Real users operate in environments you cannot fully reproduce during development.
They have different devices.
Different network connections.
Different operating system versions.
Different usage patterns.
Different amounts of available storage.
That’s why production monitoring matters.
Track metrics such as:
- App startup time.
- Screen loading time.
- Crash rate.
- ANR or hang rate.
- Memory usage.
- Network latency.
- API failures.
- Battery consumption.
- Frame rendering performance.
- Slow transactions.
The goal is to identify performance regression before it becomes a major user complaint.
Common Reasons Mobile Apps Become Slow
When troubleshooting a slow app, these are some of the most common causes to investigate:
Too much work during startup
The application tries to initialize everything before displaying useful content.
Large network responses
The server sends far more data than the mobile interface actually needs.
Unoptimized images
Large images consume bandwidth, memory, and processing power.
Too many API requests
Multiple sequential requests create unnecessary waiting.
Main-thread blocking
Expensive work prevents the UI from responding.
Inefficient database queries
The application repeatedly retrieves or processes unnecessary data.
Excessive memory usage
Large objects and resources remain in memory longer than necessary.
Inefficient rendering
Complex views or excessive re-rendering create scrolling and animation problems.
Poor caching
The app repeatedly downloads or calculates information it already has.
Heavy third-party SDKs
External libraries add initialization and background workload.
Testing only on high-end devices
Problems remain hidden until users with slower hardware encounter them.
A Practical Mobile App Performance Optimization Workflow
If you’re responsible for improving an existing app, don’t try to fix everything at once.
Start with the biggest user-facing problem.
Phase 1: Establish a baseline
Measure startup time, screen loading, network latency, memory usage, rendering performance, and other relevant metrics.
Phase 2: Find the bottleneck
Use profiling tools to determine whether the problem is CPU, memory, network, database, rendering, or background work.
Phase 3: Fix one major issue
Don’t change ten things simultaneously.
Make one meaningful optimization.
Phase 4: Measure again
Compare the result against your original measurement.
If the metric didn’t improve, investigate further.
Phase 5: Test across devices
Verify the improvement on different device classes and network conditions.
Phase 6: Monitor production
Make sure the optimization survives real-world usage.
This measurement-first approach is consistent with Apple’s recommended performance improvement cycle and Android’s emphasis on profiling and production monitoring.
Quick Mobile App Performance Checklist
Before releasing an app, verify that:
- Startup doesn’t perform unnecessary work.
- Expensive operations don’t block the UI.
- Images are appropriately sized and compressed.
- Large lists use efficient rendering.
- API responses contain only necessary data.
- Network requests are minimized and cached where appropriate.
- Database operations are optimized.
- Memory usage is monitored.
- Background work is limited to what is necessary.
- Animations remain smooth on lower-end devices.
- Third-party SDKs have been evaluated for performance impact.
- The app has been tested on physical devices.
- Performance has been tested under slower network conditions.
- Production performance is monitored after release.
What If the App Is Still Slow After Optimization?
If you’ve optimized images, reduced API requests, improved database queries, moved heavy work away from the UI thread, and profiled memory and CPU usage, but the app still feels slow, look at the architecture.
Sometimes the problem isn’t one bad function.
It may be the way data flows through the entire application.
For example, a screen might depend on several backend services, require multiple sequential requests, process a large dataset locally, and render everything simultaneously.
In that situation, optimizing a single function won’t solve the underlying problem.
You may need to rethink how the screen loads data, how the backend responds, how caching works, or which features need to be loaded immediately.
Apple also points out that performance fixes can sometimes require changes beyond a single line or function, including architectural changes.
Native Apps and Performance
For businesses turning an existing website into a mobile app, performance deserves special attention.
Simply placing a website inside a mobile wrapper doesn’t automatically produce the best mobile experience.
A mobile app needs to account for mobile hardware, network conditions, native navigation, device resources, caching, images, and platform-specific behavior.
This is particularly important for ecommerce stores, directories, booking platforms, hotel websites, restaurant platforms, real estate websites, and other content-heavy websites.
If your app depends on large web pages, excessive scripts, oversized images, or slow API requests, users may experience the same performance problems they already encounter on the website.
A well-built native mobile experience can instead focus on the mobile use case and optimize how information is loaded and presented.
Building a Faster Mobile App Without Starting From Scratch
Not every business needs to build a mobile app from the ground up.
If you already have a working website, ecommerce store, directory, booking platform, hotel website, restaurant website, or other web-based business, rebuilding the entire experience as a native mobile app can require significant development time, technical resources, and ongoing maintenance.
This is where AppNatively can be useful.
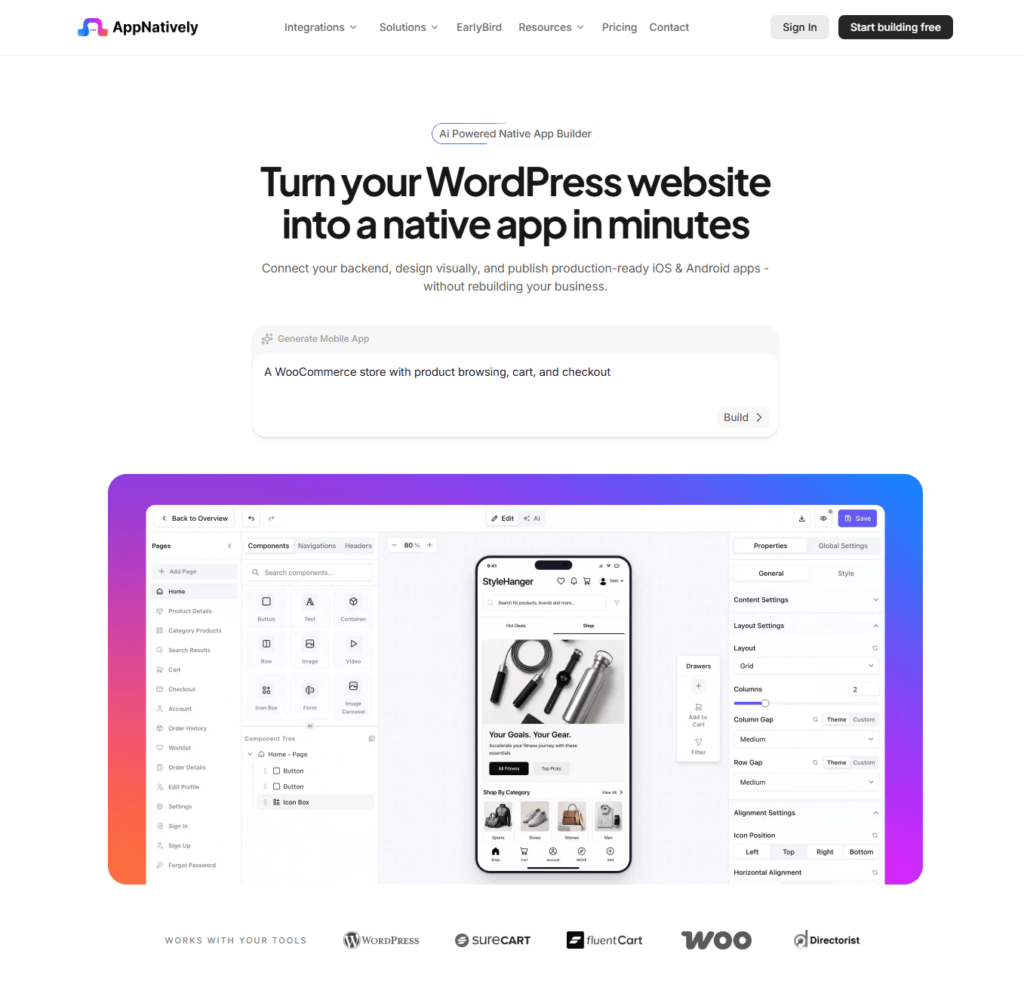
AppNatively is a drag-and-drop native app builder that helps businesses turn their existing websites into native mobile apps without having to build everything from scratch.
Instead of starting with an empty mobile project, you can connect your existing website and create an app around the business logic, content, and functionality you already have.
Why this matters for app performance
Creating a mobile app from an existing website doesn’t automatically solve performance problems. The quality of the mobile implementation still matters.
A good mobile app should be designed around mobile users rather than simply displaying a website inside an app.
AppNatively focuses on creating native mobile experiences, giving businesses a way to migrate from an existing website to mobile apps while reducing the development effort typically required to start a native app project from scratch.
This can be particularly useful for:
WooCommerce stores that want a dedicated shopping app.
Directory websites that want users to browse listings from their phones.
Booking platforms that need mobile access to reservations and services.
Hotel and restaurant websites that want to make their services more accessible through mobile.
Real estate websites that want users to browse properties from a dedicated app.
The bigger advantage is that you can continue improving the underlying mobile experience instead of treating the app as a one-time project.
From Website to Native App
If your website is already generating traffic and customers, you don’t necessarily need to abandon everything you’ve built to enter the mobile app market.
With AppNatively, you can use your existing website as the foundation and create native Android and iOS apps around it.
You can start with the free option, explore how the builder works, and decide whether it fits your business before committing to a larger app development project.
Want to turn your existing website into a native mobile app? Try AppNatively and see how quickly you can move from website to mobile.
Final Thoughts
Fixing slow mobile app performance isn’t about making everything faster at once. It’s about finding the right bottleneck and removing it.
Start with measurement. Find out whether your biggest problem is startup time, network latency, memory usage, database processing, rendering, or main-thread work.
Then make one targeted improvement and measure the result.
The most effective performance strategy is continuous. Android and Apple both provide profiling and monitoring tools because performance should be treated as an ongoing engineering process rather than a one-time optimization project.
A fast app doesn’t simply load quickly.
- It responds quickly.
- It scrolls smoothly.
- It uses resources responsibly.
- It works reliably across different devices and networks.
And most importantly, it makes users feel like the app is working with them rather than making them wait.
Frequently Asked Questions
Why is my mobile app so slow?
Common causes include excessive startup work, slow APIs, large images, inefficient database queries, memory problems, expensive UI rendering, too many third-party SDKs, and blocking the main thread.
How can I make my app load faster?
Reduce startup work, defer non-critical initialization, optimize images, minimize network requests, improve API response times, cache frequently used data, and profile startup performance on real devices.
Why is my app slow after using it for a long time?
Gradually worsening performance can indicate excessive memory usage, memory leaks, growing datasets, inefficient caching, or resources that aren’t being released properly.
Can large images slow down a mobile app?
Yes. Large images can increase download time, memory consumption, image decoding work, and rendering cost. Serve images at appropriate dimensions and use efficient formats and caching strategies.
How do I find what’s making my Android app slow?
Use Android Studio’s profiling tools to investigate CPU, memory, rendering, and other resource usage. Android recommends profiling rather than relying on assumptions when diagnosing performance problems.
How do I diagnose slow iOS app performance?
Use Xcode Organizer and Instruments. Apple recommends tools such as Time Profiler, Allocations, Leaks, Energy Log, File Activity, and Network depending on the type of performance problem.
Does a slow internet connection always mean the app is poorly optimized?
No. Network conditions can naturally introduce latency. However, a well-designed app can reduce the impact through caching, smaller responses, progressive loading, appropriate image sizes, and fewer unnecessary requests.
Should I optimize performance before launching my app?
Yes. You don’t need to achieve perfect performance before launch, but major startup, responsiveness, memory, and network problems should be identified before users encounter them at scale.
Share this blog: